Digital humanities is an area that I’ve been interested in for a long time but which I haven’t had much opportunity to engage with, so earlier this week I was really excited to be able to go along to the Digital Scholarship Day of Digital Ideas at the University of Edinburgh. In the absence of my EDINA colleague Nicola Osborne and her fabulous live blogging skills, I live tweeted the event and archived tweets, links and references in a storify here: Digital Day of Ideas 2015. I also created a TAGS archive of tweets using Martin Hawksey’s clever Twitter Archiving Google Spreadsheet.
The event featured three highly engaging keynotes from Ben Schmidt, Anouk Lang, and Ruth Ahnert, and six parallel workshops covering historical map applications and OpenLayers, corpus analysis with AntConc, data visualisations with D3, Drupal for beginners, JavaSCript basics and Python for humanities research.
Humanities Data Analysis
~ Ben Schmidt, Northeastern University
Ben explored the role of data analysis in humanities and explored the methodological and social challenges presented by humanities data analysis. He began by suggesting that in many quarters data analysis for humanities is regarded as being on a par with “poetry for physics”. Humanities data analysis can rase deep objections from some scholars, and seem inimical to the meaning of research. However there are many humanistic ways of thinking about data that are intrinsic to the tradition of humanities. Serendipity is important to humanities research and there is a fear that digital research negates this, however it’s not difficult to engineer serendipity into cultural data analysis.
But what if borrowing techniques from other disciplines isn’t enough? Digital humanities needs its own approaches; it needs to use data natively and humanistically, as a source of criticism rather than to “prove” things. Humanities data analysis starts with the evidence, not with the hypothesis. The data needs to tell stories about structures, rather than individual people. Johanan Drucker argues that what we call “data” should really be called “capta”:
Capta is “taken” actively while data is assumed to be a “given” able to be recorded and observed. From this distinction, a world of differences arises. Humanistic inquiry acknowledges the situated, partial, and constitutive character of knowledge production, the recognition that knowledge is constructed, taken, not simply given as a natural representation of pre-existing fact.
Ben went on to illustrate these assertions with a number of examples of exploratory humanities data analyses including using ngrams to trace Google books collections, building visualisations of ship movements from digitised whaling logbooks, the Hathi Trust bookworm, and exposing gendered language in teachers reviews on Rate my Teacher. (I’ve worked with ships musters and log books for a number of years as part of our Indefatigable 1797 project, I’ve long been a fan of Ben’s whaling log visualisations which are as beautiful as they are fascinating.)
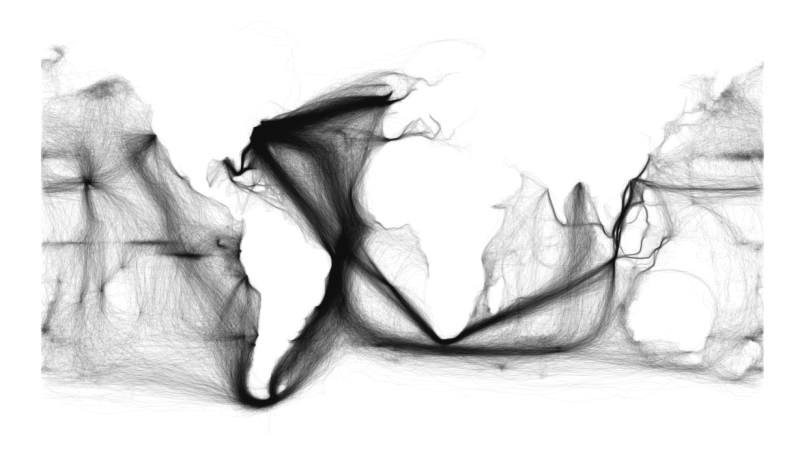
Ships tracks in black, show the outlines of the continents and the predominant tracks on the trade winds. © Ben Schmidt
Ben concluded by introducing the analogy of Borges The Garden of Forking Paths and urged us to create data gardens and labyrinths for exploration and contemplation, and to provide tools that help us to interpret the world rather than to change it
Gaps, Cracks, Keys: Digital Methods for Modernist Studies
~ Anouk Lang, University of Edinburgh
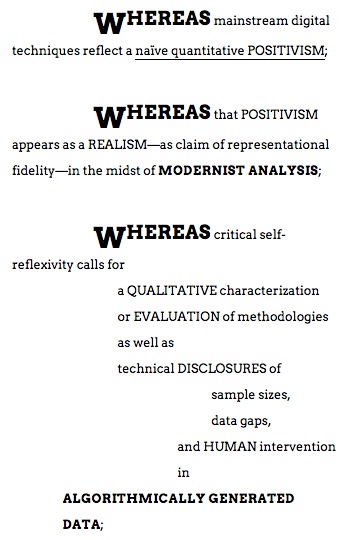
Manifesto of Modernist Digital Humanities
Anouk explored the difficulties and opportunities facing scholars of twentieth-century literature and culture that result from the impact of copyright restrictions on the digitisation of texts and artefacts. Due to these restrictions many modern and contemporary texts are out of digital reach. The LitLong project highlights gaps in modernist sources caused by copyright law. However there are cracks in the record where digital humanities can open up chinks in the data to let in light, and we can use this data as the key to open up interesting analytic possibilities.
During her presentation Anouk referenced the Manifesto of Modernist Digital Humanities, situating it in reference to the Blast Manifesto, Nathan Hensley’s Big Data is Coming for Your Books, and Underwood, Long and So’s Cents and Sensibility.
By way of example, Anouk demonstrated how network analysis can be used to explore biographical texts. Biographies are curated accounts of people’s lives constructed by human and social forces and aesthetic categories. There is no such thing as raw data in digital text analysis: all the choices about data are subjective. Redrawing network maps multiple times can highlight what is durable. For example network analysis of biographical texts can reveal the gendered marginality of writers’ wives.
In conclusion, Anouk argued that digital deconstruction can be regarded as a form of close reading, and questioned how we read graphical forms such as maps and network illustrations. How do network maps challenge established forms of knowledge? They force us to stand back and question what our data is and can help us to avoid the linearity of narrative.
Closing the Net: Letter Collections & Quantitative Network Analysis
~ Ruth Ahnert, Queen Mary University of London
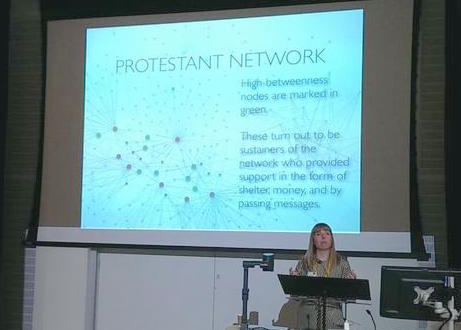
Ruth’s closing keynote explored the nature of complex networks and the use of mathematical models to explore their underlying characteristics. She also provided two fascinating examples of how social network analysis techniques can be used to analyse collections of early modern letters, a set of Protestant letters (1553 – 1558) and Tudor correspondence in State Papers Online, to reconstruct the movement of people, objects, and ideas. She also rather chillingly compared the Tudor court’s monitoring of conspiracies and interception of letters with the contemporary surveillance activities of the NSA.
Ruth Ahnart. Picture by Kathy Simpson, @kilmunbooks.
Ruth introduced the concept of betweenness* – the connectors that are central to sustaining a network. Networks are temporal, they change and evolve over time as they are put under pressure. Mary I took out identifiable hubs in the Protestant network by executing imprisoned leaders, however despite removing these hubs, the networks survived because the sustainers survived, these are the people with high betweenness. In order to fragment a network it is necessary to remove, not the hubs or edges, but the nodes with high betweenness.
Ruth went on to introduce Eigenvector centrality which can be used to measure the quality of people’s connections in a network, and she explored the curious betweenness centrality of Edward Courteney, 1st Earl of Devon (1527 – 1556). Courteney’s social capital is quantifiable; he was typical of a character with high Eigenvector centrality, who cuts across social groups and aligned himself with powerful nodes.
In conclusion, Ruth suggested that network analysis can be used to open archives, it doesn’t presume what you’re looking for, rather it can inspire close reading by revealing patterns previously unseen by traditional humanity research.
I was certainly hugely inspired by Ruth’s presentation. I have some passing familiarity with the concepts of network analysis and betweenness centrality from the work of Martin Hawksey and Tony Hirst however this it the first time I have seen these techniques applied to historical data and the possibilities are endlessly inspiring. One of the man aims of our Indefatigable 1797 research project is to reveal the social networks that bound together a small group of men who served on the frigate HMS Indefatigable during the French Revolutionary War. Using traditional techniques we have pieced together these connections through an analysis of ships musters, Admiralty archives, contemporary press reports, personal letters and birth, marriage and death certificates. We have already built up a picture of a complex and long-lived social network, but I now can’t help wondering whether a more nuanced picture of of that network might emerge through the application of social network analysis techniques. Definitely something to think more about in the future!
Many thanks to Anouk Lang and the Digital Scholarship team for organising such a thought provoking, fun and engaging event.
* For an excellent explanation of the concept of betweeness, I can highly recommend reading Betweenness centrality – explained via twitter, featuring Tony Hirst and my former Cetis colleagues Sheila MacNeill, Wilbert Kraan, and Martin Hawksey. It’s all about the genetically modified zombies you see…

Pingback: Data Visualisation with D3 workshop | Research Data Blog